
Overview
Grafana is the tool that displays the popular monitor graph. Grafana can handle a wide variety of data returned by the Zabbix Monitor. Grafana also has many other useful features that cater to the monitor
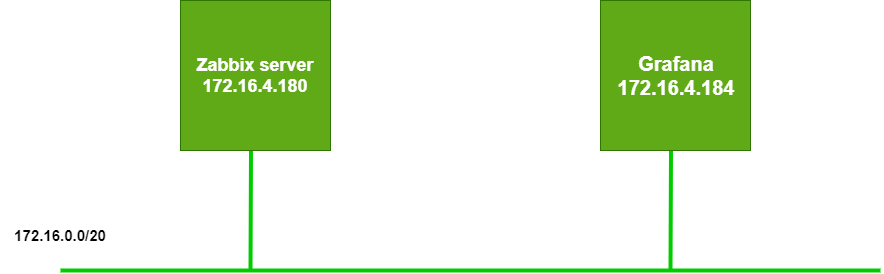
Diagram
How to configure
- Install Grafana on CentOS 7
- Download the installation package
wget https://dl.grafana.com/oss/release/grafana-6.4.4-1.x86_64.rpm
- Unzip the installation package
sudo yum localinstall grafana-6.4.4-1.x86_64.rpm
- Install Grafana
sudo yum install grafana
- Start the Grafana service
|
1 2 |
sudo yum install grafana sudo /sbin/chkconfig --add grafana-server |
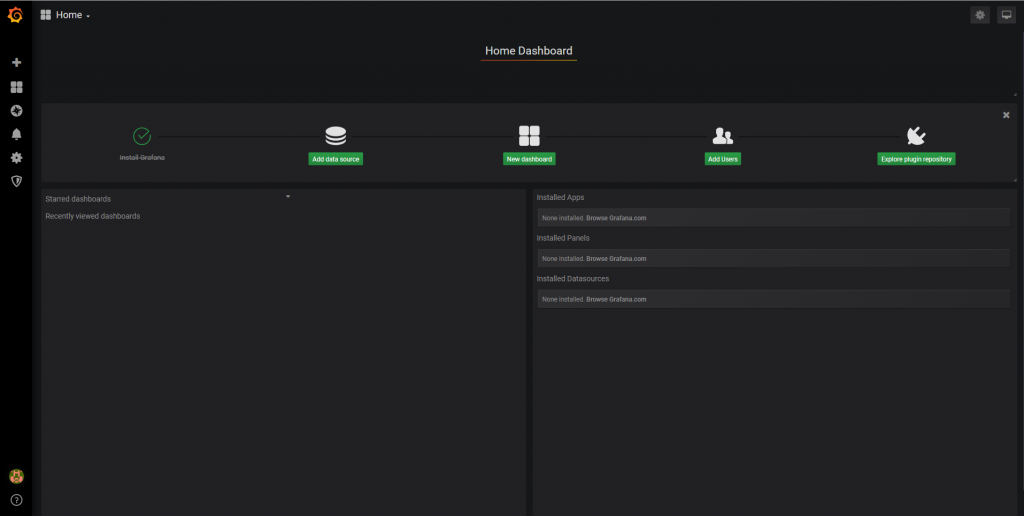
- Access to the Admin web interface of Grafana according to the address http://ip_grafana: 3000
- The default Port is 3000
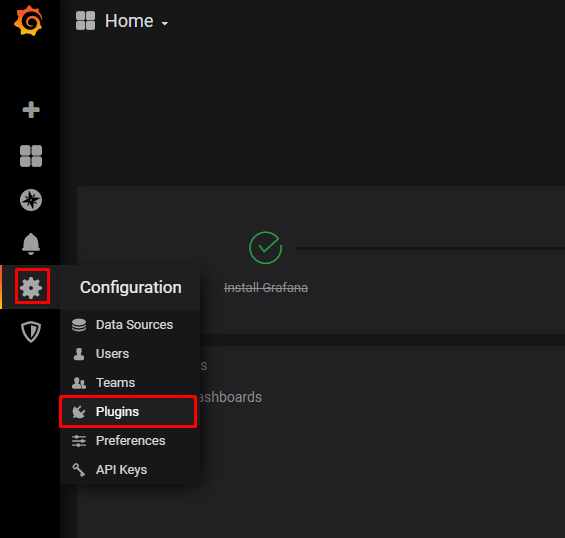
- Add Zabbix into Grafana
- Click icon Setting -> Choose Plugins
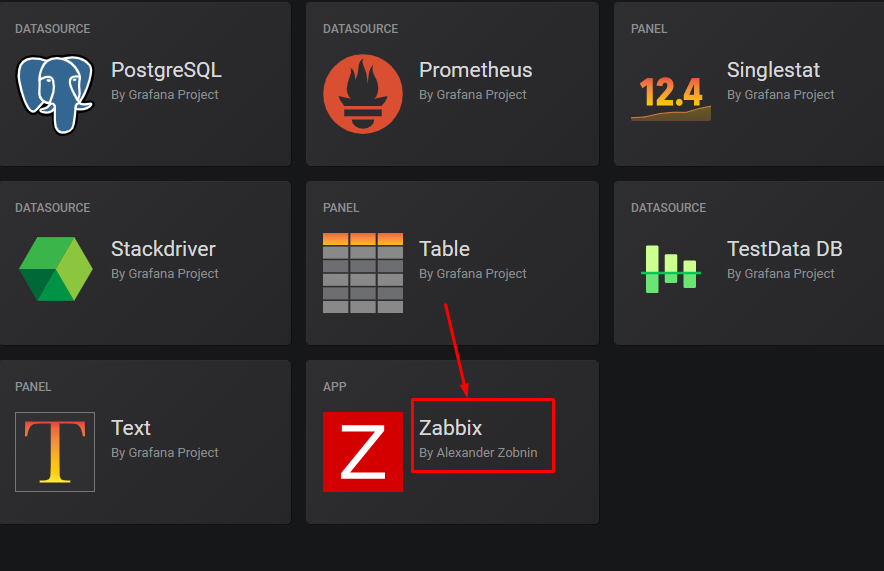
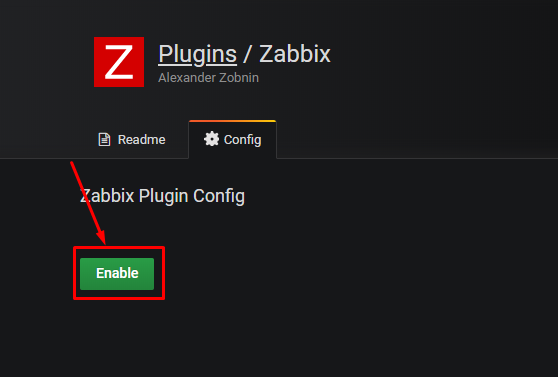
- Find and choose Zabbix
- Enable Zabbix on Grafana
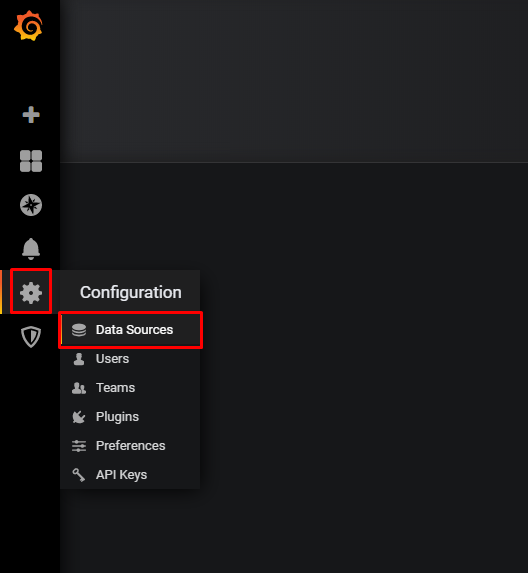
- Choose icon Setting -> Choose Data Sources
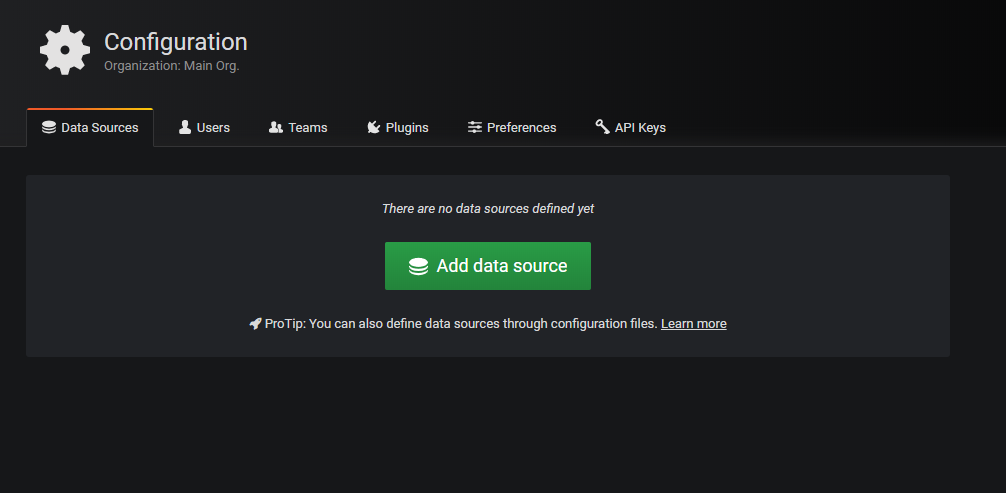
- Click Add data source
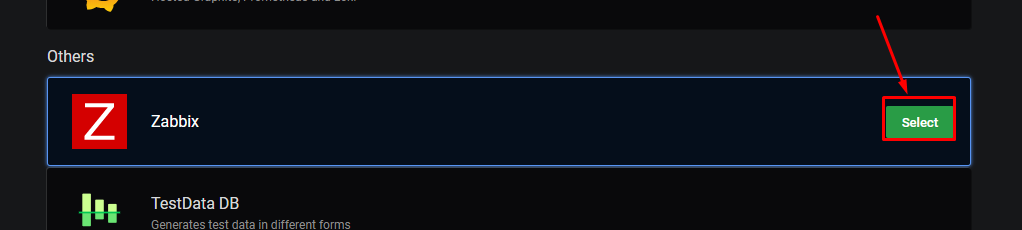
- Choose Zabbix
- In URL: Enter http://IP_Zabbix_Server/zabbix/api_jsonrpc.php
- In Username: Use Admin account of Zabbix
- In Password: Use Admin account of Zabbix
- In Zabbix version: Select version corresponding to Zabbix Server
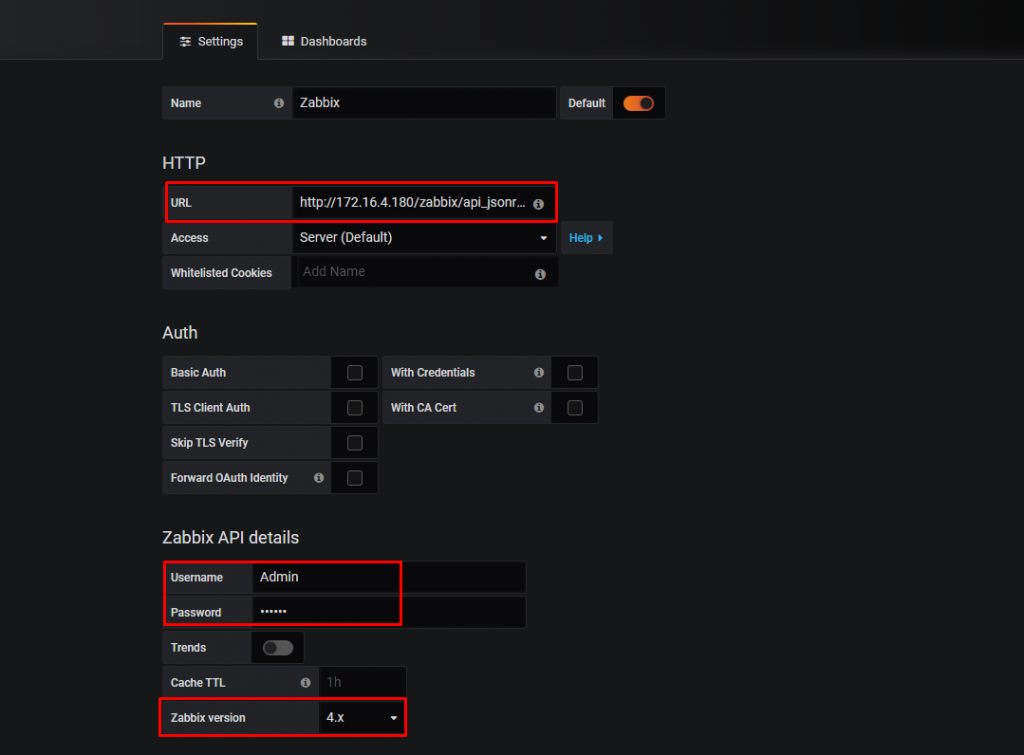
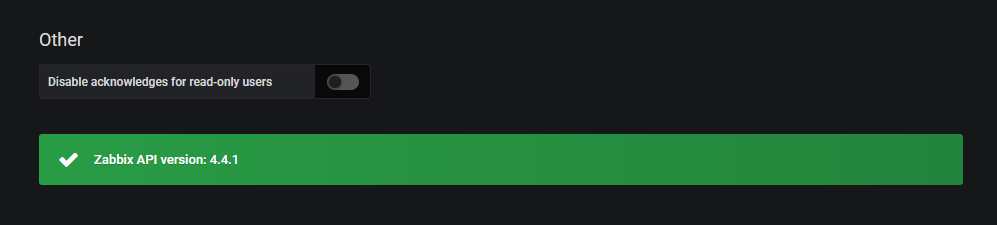
- Test connection
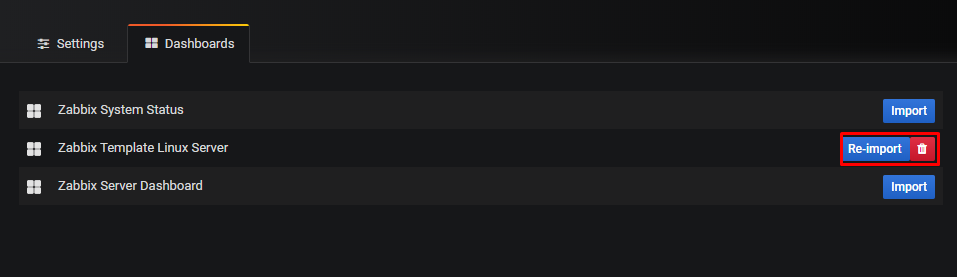
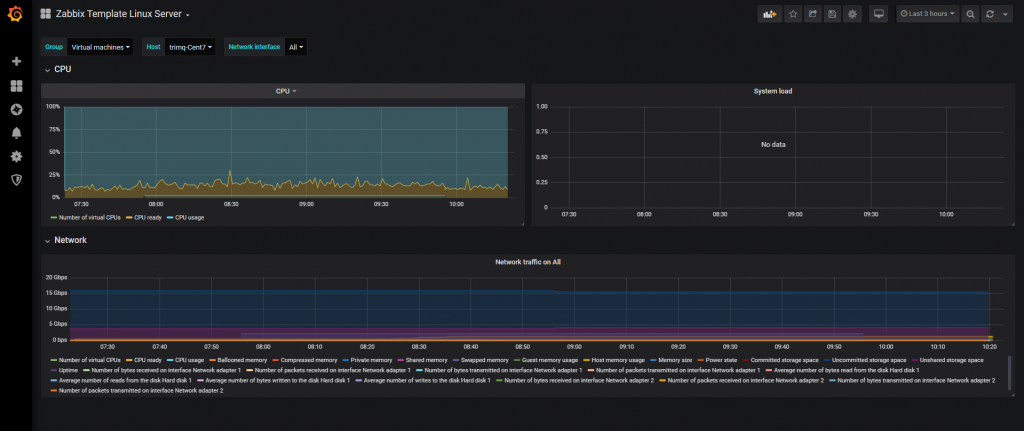
- Import template
Leave a Reply