1 Overview
Harmony endpoint logs menu allows you to modify logs and view to manage all of your endpoint in 1 location. You can open a multi tab to search different logs, and with help of query, you can quickly get all of the information that you need.
2 Logs

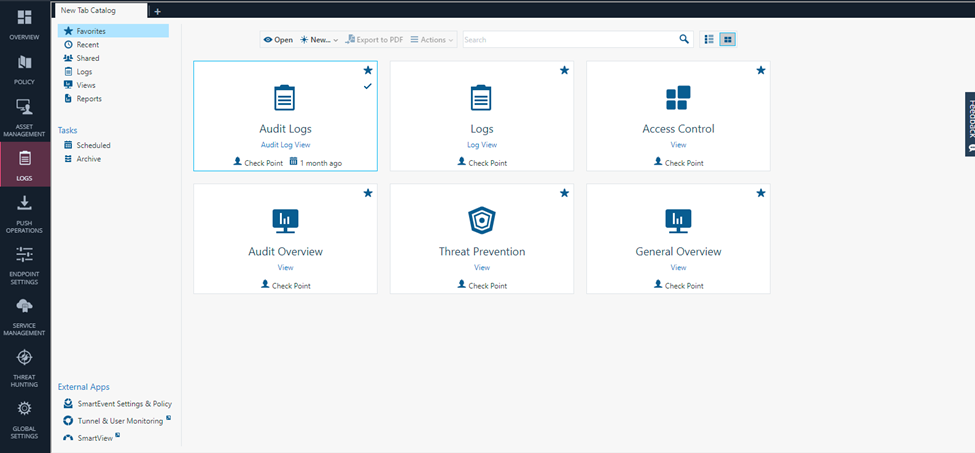
- Favorites: Select one of the Logs or View that you marked with the Favorite icon
- Recent: Select one of the Logs or Views that you opened recently
- Shared: Select a view that was shared with you
- Logs: Select one of the widgets with logs collected from all Harmony Endpoint clients
- Views: Select one of the Views with data from all available blades, services, and applications
- Reports: Select one of the available reports
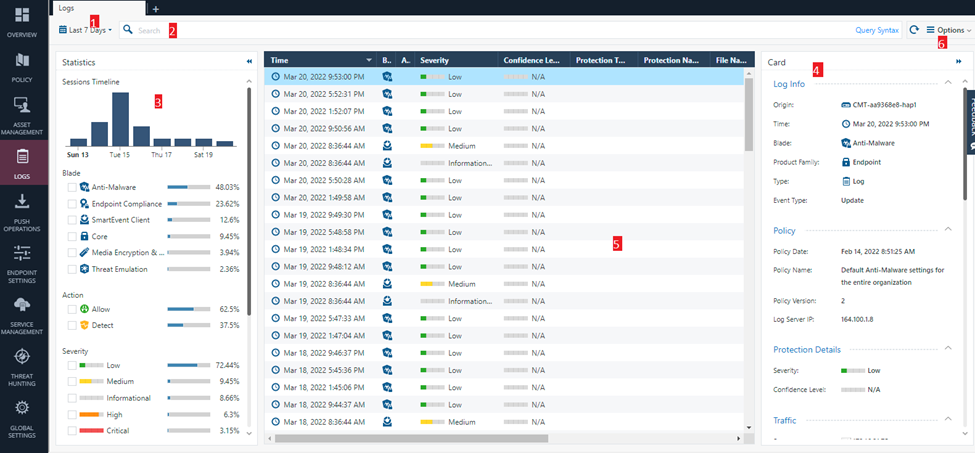
After open new log, you can view the dashboard:

- Time period: Search with predefined custom time periods or define another time period for the search.
- Query search bar: Enter your queries in this field.
- Statistic pane: Shows statistics of the events by Blades, Severity of the event and other parameters.
- Card: Log information and other details.
- Results pane: Shows log entries for the most recent query.
- Options: Hide or show a client identity in the Card, and export the log details to CSV.
3 Query Language

With Query you can quickly search information about log that you need to find. To create query, we user the basic query syntax:
[<Field>:] <Filter Criterion>To put together many criteria in one query, use Boolean operators:
[<Field>:] <Filter Criterion> {AND | OR | NOT} [<Field>:] <Filter Criterion> …To use Phrase we insert value in “…”
EX: user:“John Doe”
Wildcard: ? match 1 character, * match multiple characters.
EX: user:Joh?, user:Jo*
We can divide conditions by ().
EX: source:(192.168.2.1 OR 192.168.2.2) AND destination:17.168.8.2

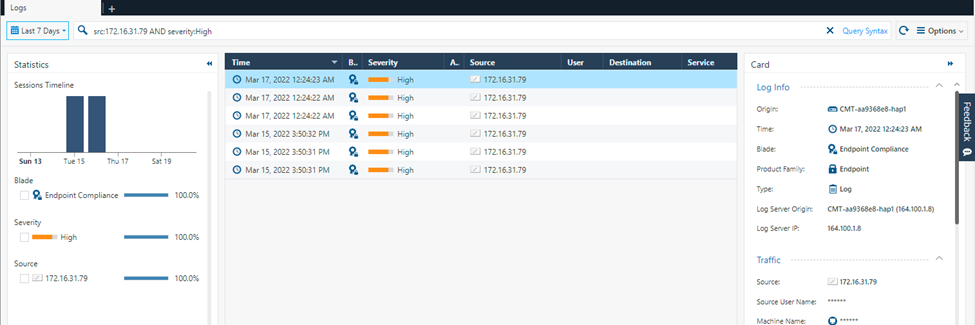
In the example above i query log with source 172.16.31.79 and with the severity is high.
So that’s all for this post. Thanks for reading. Best regards.
Leave a Reply